We thank you for installing ManageEngine OpManager an easy to install, easy-to-use, affordable network and server monitoring software.
OpManager Essential and Enterprise edtions now include add-ons for managing bandwidth, configurations, firewall logs, IP addresses and switch ports. All these add-ons can be enabled by license and doesn't need any additional installation.
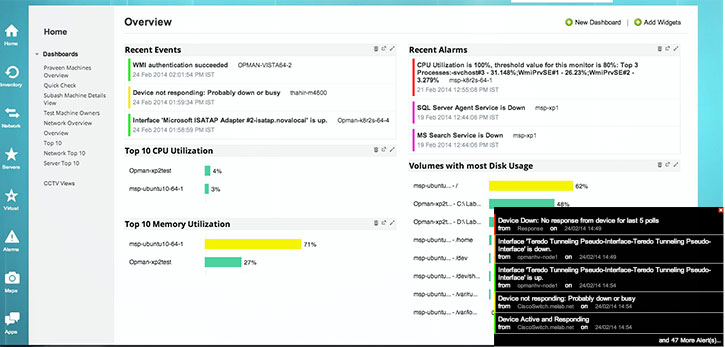
New web client to access all the data at one screen. Improved dashboards and snapshot pages show all performance monitoring and management data for quick decision making and troubleshooting.
OpManager Essential and Enterprise editions can now scale upto 50,000 devices or 1 million interfaces from a single server.
Automatically discover the newly added devices in the network with Scheduled Discovery. You can not only schedule, but create multiple profiles and choose the Discovery Rules that should apply to the devices and select the interfaces that you wish to discover.
If you are using any competing products of OpManager, you can import the configuration data from them using the migration tool.
OpManager now monitors Citrix Xen Servers via XenServer APIs for performance. Provides a map of the host-VM relationship.
Options to add aisles, walls and walk paths in 3D floor views has been added newly in OpManager v11.6.
Now discover VLANs from the Switch snapshot page and monitor all the interfaces in the VLAN for bandwidth and utilization.
OpManager now supports to migrate your configuration and performance data from Enterprise Edition to Large Enterprise Edition.
Now you can upgrade your OpManager setup to the latest version automatically with the new Auto Upgrade feature. This feature check for the latest ppm release by ManageEngine for OpManager and automatically downloads it and applies it on your OpManager setup at preconfigured time.
Private groups in Social IT allows to carryout discussions on a project within the project members. The admin of the group can invite as many people to join the group. Only the group members will have access to view the discussions that happen in these groups.
You can now create performance dials for monitors that you wish and have them on the snapshot page. All you need to do is enable the "show dial" option for the corresponding monitor in device template.
Support for monitoring the performance of Exchange 2013 environment is newly added.
Leveraging Cisco UCS XML API, UCS Monitoring add-on helps you to monitor all the Cisco UCSes and its components, in your data center. The UCS monitor includes a 2D relationship map that helps you to visualize the relationship among the hosts, clusters, and VMs present in the UCS.
With the help of EventLog Analyzer plug-in, you can manage machine generated logs, monitor file integrity, conduct log forensics analysis, comply to different regulatory bodies and generate variety of reports instantly. In addition, it also offers real-time event correlation with over 70+ out-of-the-box correlation rules for proactive threat management. Learn More »
OpStor Plug-in helps you to monitor the storage devices like Storage Arrays, Fabric Switches, Tape Libraries, Tape Drives, Host servers and Host Bus Adapters cards from all leading vendors in the industry. Apart from this, it also provides topological map, storage capacity forecasting, real-time graphs & various reports on resource utilization, device availability and performance trends.
Some of the exciting enhancements that are newly added to network mapping are
OpManager now includes the highly productive, faster and API driven user interface by default. The new web client will be the default UI for new installations. However, the existing customers can use the same old client and switch to the new UI anytime. This new user interface also comes with number of intuitive keyboard shortcuts such as clearing an alarm using the ALT+C combination and many more.
OpManager now includes Social IT- a private social networking medium built exclusively for IT folks. Social IT provides a cascading, Facebook-like wall for threaded discussions enabling real-time collaboration/communication between IT staffers. Social IT can also be integrated with IT management tools from ManageEngine as well as from BMC, CA, HP, IBM and other vendors with the help of REST APIs.
OpManager can now be configured to detect event floods and anomalous event rates with predefined rules, and to perform remedial actions. To know more about OpManager’s event handling functionality, visit the help guide.
OpManager now extends its monitoring capability by supporting Windows 2012 R2 servers and the Hyper-V in it.
With the new enhanced discovery engine in OpManager, you can now discover up to 20,000 devices in 5 minutes & 1 million interfaces in 1 hour. This helps to reduce the time spent on discovering your complete IT infrastructure from days to just few minutes.
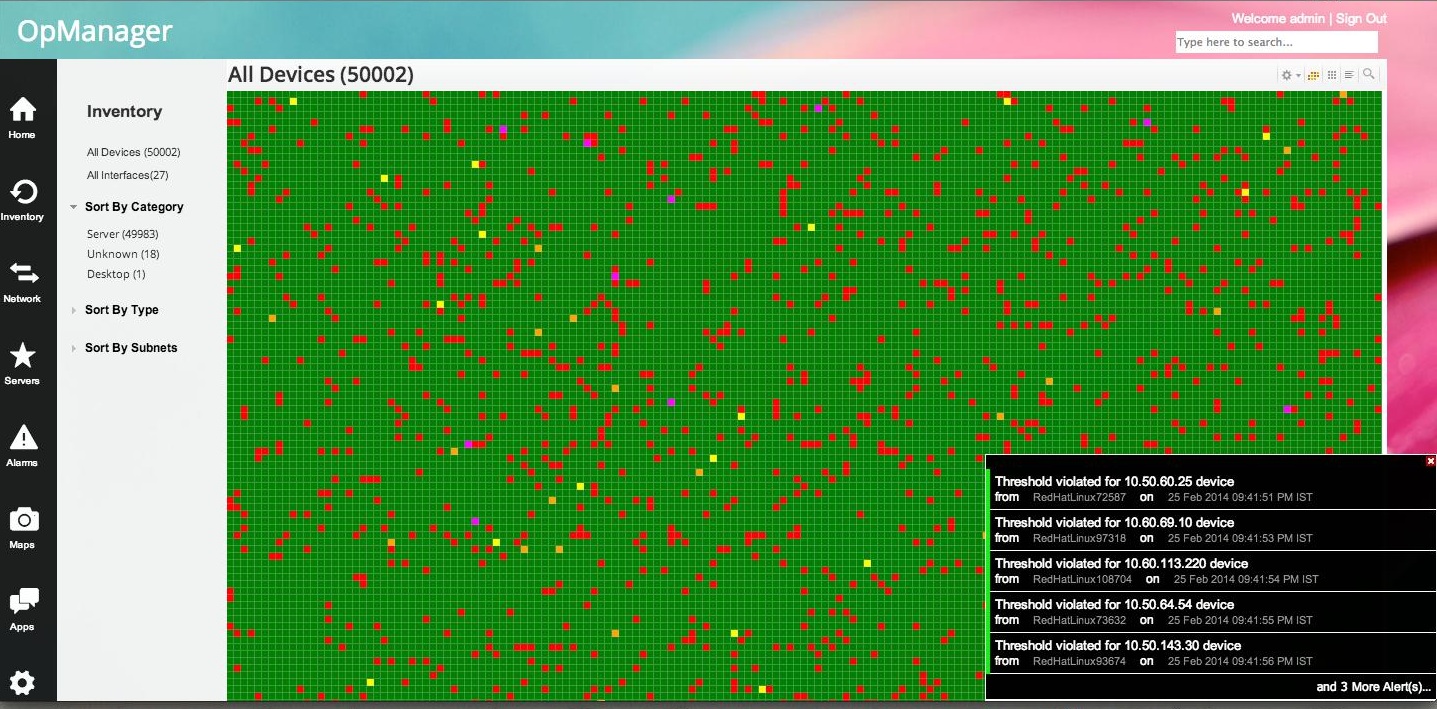
HeatMaps in OpManager helps to visualize your entire network health in real-time from a single page. It uses color codes to communicate the severity of the monitored devices. HeatMap view can be accessed from the inventory section.

Now with the help of popup notifications, you get to know what’s happening in your network in real-time. These notifications pops up at the bottom of the screen instantly alerting you about the alarms raised. This keeps you up-to-date on all the alerts generated in OpManager and limits the impact of failures on network performance.

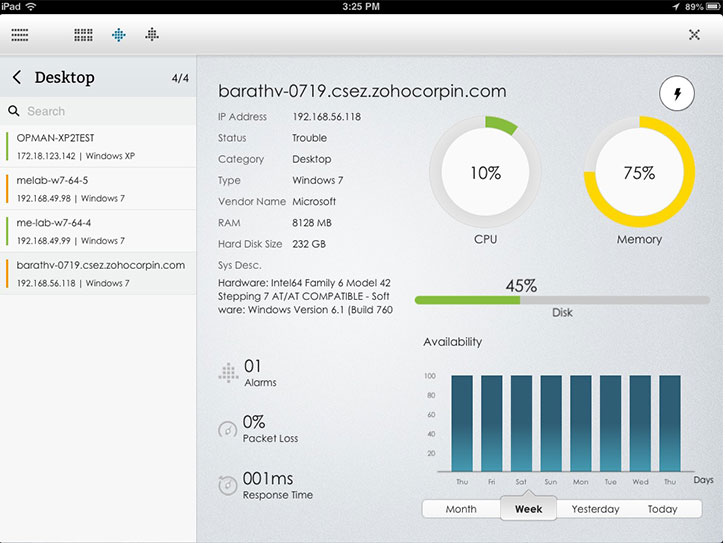
The new OpManager iPad app helps you to stay connected with your network on the move. It offers you a quick look at the availability and performance of your IT, customizable dashboards to suit your business needs and troubleshooting tools to resolve network glitches from anywhere. Learn More

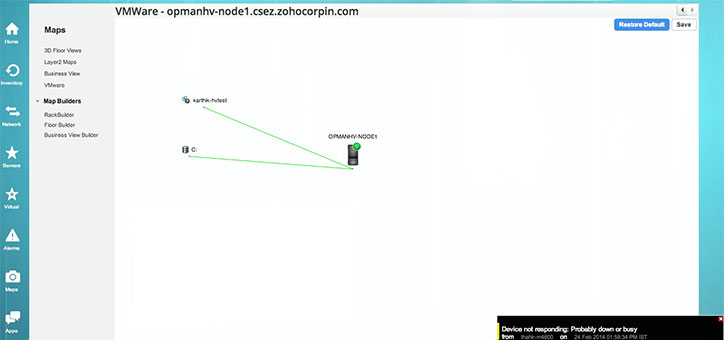
Virtualization maps for VMware & Hyper-V provide a visual representation of relationships among hosts, clusters, and virtual machines. It helps you to gain quick visibility into your virtualized IT environment.

Enhanced Layer2 Network Mapping in OpManager now supports discovery of non cisco devices and end nodes (server, desktop). It also draws the Layer2 topology maps for the devices which are not discovered/ monitored in OpManager.
With CMDB plug-in, you can get in-depth visibility of the assets present in your IT environment. It provides a unified view of all Configuration Items, including their attributes and relationships which helps in identifying the dependencies and impact of CIs before performing any changes. The plug-in allows network admins to make informed decisions based on their business criticality.
Root Cause Analysis module centralizes all the events from NetFlow, configuration management, and application management plug-ins and plots them on time-based multi-series graph. This helps the IT team to have visibility at the recent events and identify where the exact fault is.
You can now switch between multiple languages from OpManager webclient. You can set the preferred language from Admin-> Personalize-> Language Selection.
With this Pass-Through Authentication, OpManager directly authenticates all the users logging on to their windows desktops with user name, password, and domain credentials. Users need not reenter their credentials over again.
With OpManager's 3D Data Center Builder, you can virtually create an exact replica of your racks and data centers. You can embed the views of your designs on your NOC screens and monitor them 24x7. The 3D data center can also be viewed from iPad and other tablets. This helps you to quickly access your data center from anywhere, anytime. [Watch Video]
Bingo! You can now clear an alarm with ALT+C right from your keyboard. No more click click click... Navigate device snapshot pages, alarm snapshot pages, Maps everything from your keyboard keys.
Welcome to a high productive, ultra-fast, responsive, API driven OpManager user interface. Built completely on a new JavaScript framework it offers you 10x productivity. [Watch Video]
Good news for all our enterprise customers. You can now avail APM plugin in OpManager central webclient. Previously the APM plugin was available only in the standalone version.
With Applications Monitoring plugin, you can gain visibility into the performance of your critical applications such as Oracle, SAP, Sharepoint, Websphere, etc. from a single integrated console. The plugin also includes options to monitor end-user experience and in-depth application performance in real-time.
We have some new comers into our long list of 600 device templates. Now you can make you of APC PDU (Series 7800/ 7830 / 8841/8858 / 8858NA3) templates which are newly added to OpManager device templates. With the help of these templates, you can monitor parameters such as PDU Phases, PDU Power/Phase Load, PDU Voltage, PDU Bank Load & many more.
OpManager now includes applications monitoring plugin for in-depth monitoring of mission critical applications that include SAP, Websphere, Sharepoint, etc. This helps you gain visibility into application performance also. [Watch Video]
OpManager now supports monitoring hardware parameters such as voltage, power, fan speed, and status of processors of all the leading vendors. You can also generate reports on hardware health. [Watch Video]
OpManager Central (enterprise edition) now supports failover. This helps you achieve 24x7 monitoring of your distributed network.
OpManager leverages vSphere API for monitoring VMware host and VMs. This provides better understanding and control over your VMware infrastructure. [Watch Video]
OpManager now supports monitoring IPv6 devices. The IPv6 devices can be added and monitored much like the IPv4 devices. [Watch Video]
The release of OpManager Version 9 consolidates the editions into an Essential Edition for small and medium enterprises, and an Enterprise Edition for large enterprises. The OpManager Essential Edition manages upto 500 servers/network elements. The Enterprise Edition is designed to scale and manage large and remote networks. It can manage up to 50,000 interfaces from a single console. More here...
Upgrade a standalone instance of OpManager to an enterprise Probe on-the-fly. This doesn't require you to starte from the scratch and discover the network all over again! You can start from where you left! The Enterprise edition scales to monitoring over 500 devices or 10,000 interfaces.
Ensure high availability of OpManager by setting up hot-standby for Probes. You can now enjoy 24/7, uninterrupted network monitoring. The primary Probe fails over to a secondary probe and fails back as soon as the primary is up and the data across the redundant instances are always synchronized.
OpManager performs Class-less Inter-Domain Routing-based automatic discovery of network devices, services and applications, apart from Range and CSV file import options.
OpManager does an automatic Layer 2 and Layer 3 network discovery and mapping. The option to choose the "seed device" and the "network layout type" lets you come up with a neat representation of your network diagram, which can also be exported to Microsoft Visio. Further, the display of real-time health of devices and links empowers administrators with quick fault recognition and prevention.
OpManager comes with over 650 device templates enabling smart classification of the devices into Servers, Firewalls, Switches, Routers, Printers and Desktops, all grouped in different views. Also, try your hand at defining new templates and proudly share with other users!
Automate actions such as adding monitors, associating the devices to a business, etc. that you carry out after adding the devices to OpManager. This helps you monitor the devices as soon as they are added to OpManager without any delay, and also avoids the repetitive manual effort.
Create your own infrastructure views and the Business views for grouping systems and applications together intelligently for effective management (i.e. group by geography, business process, device type etc.). Business views-based reports are also available.
Provision to bulk-import devices into different categories enables easy management and configuration.
Now allow all the active directory users or the users in a specific group of an AD domain to gain access to OpManager web-client. The access privileges can be managed by the administrator. Alternatively, the administrator can also add an individual user and choose the 'AD authentication' user type for authenticating the user access through Active Directory. [Watch Video]
OpManager comes with comprehensive Performance Management functionality with a host of real-time graphs and historical reports for Availability, Utilization, Response times, Packet-loss and Inventory. You can monitor just about any resource on your network! Hereʼs a quick run-through of few categories and resources monitored:
OpManager leverages the industry–standard Cisco management technologies viz., NetFlow, IPSLA, NBAR etc., to monitor and manage all the network devices in the Cisco gamut. OpManager comes with over a 160 exclusive device templates for several variants of Cisco devices.
OpManager offers specialized views for routers and monitors the links for availability. It analyzes the traffic, utilization and error statistics. Help you analyze trends and plan your capacity with historical trends and reports. An intuitive user interface allows user to manage all infrastructure from a single console. Lets you add all the links to be monitored at one shot and also can drill down to see the root cause of poor WAN availability or performance using WAN RTT monitoring and NetFlow plugin
Ensure high quality of service in real-time for VoIP or Rich Multi-media traffic. Provides live visibility on performance and alerts immediately on outages and performance degradations. The dashboard is designed carefully to help you analyze the historical trends and troubleshoot during degradations.
Provides live view of Switches with out-of-the-box monitors for port utilization and critical resource parameters. OpManager allows you to configure thresholds to detect and prevent broadcast storms or any network irregularities.
Feel the pulse of your bandwidth with the new NetFlow monitoring plug-in. Monitor, Analyze, Identify who or which application is causing the bandwidth spike and plan your bandwidth scientifically.
A separate category for Firewall is available under Infrastructure Views and the monitored resources include CPU, Memory, Active Connections etc. Integrating with Firewall Analyzer will help you to get insight on Security and Traffic related information. (Learn more)
Specialized views for monitoring wireless Access Points. Create templates for different wireless devices.
OpManager offers real-time visibility into the health of Servers in the network. Support out-of-the-box for IBM-AIX, HP-UX and Windows Vista too.
- Supports monitoring of HTTP, FTP, HTTPS, DNS, LDAP, NTP, MySQL, Oracle, MSSQL and more
- Monitors CPU, Memory and Disk Utilization
- Monitors key hardware parameters viz. Server Temperature for HP/ Compaq, Dell and IBM servers
- Provides out-of-the-box graphs and reports for server availability, response times and utilization
- Monitors Windows Services and Event Logs
- Monitor your Windows server performance in-depth with 25+ windows exclusive monitors
- Monitors Intranet or Internet URLs (HTTP or HTTPs site, supports monitoring of sites which require Authentication)
- Process Monitoring
- Supports Monitoring Applications like Oracle, Lotus Domino, RDBMS related monitors and offer specialized dashboards for Exchange, MS-SQL and Active Directory.
- Notifies when response time degradation occurs
OpManager’s VMware Monitor provides indepth, best-in-class VMware infrastructure monitoring and troubleshooting through over 70 deep VMware metrics; leverages VMware API. The agentless monitoring of VMware-virtualized servers gives IT administrators a single fault and performance management console for entire server infrastructure - both physical and virtual.
Monitor Microsoft Hyper-V servers for availability and performance. OpManager monitors Hyper-Vs using WMI and provides over 50 performance monitors out-of-the-box for Hyper-V hosts and VMs. An exlusive Hyper-V dashboard with details such as VMs, Datastores, Storage Adapters, Monitors, etc, you can quickly identify and address performance bottlenecks or optimize VM resources. Hyper-V hosts are automatically discovered as virtual servers during the initial network discovery.
Monitor log files of mission critical applications such as MSSQL, Oracle, etc. in real-time. The agent constantly monitors the log files for the print of a string that may even be a regex. Once that particular string is printed in the log, OpManager raises alarm. At present OpManager monitors log files printed in English only.
Consolidate and manage your network monitoring scripts in OpManager management console. OpManager executes custom scripts and parses the output to trigger meaningful alarms. Set threshold and get alerted during abnormal situations by leveraging OpManager’s fault management functionality.
OpManager offers a separate view for UPS in your network and monitors the UPS load, its status, battery status, etc.
Monitors printer availability and alerts automatically for Paper Jam, No Paper, Low Paper, No Toner, Low Toner and so on.
OpManager out-of-the-box supports monitoring NetApp devices for availability and performance. It also offers extensive reports. [Watch Video]
Navigate across the modules and integrated ManageEngine applications with OpManager's new, enhanced GUI. The intuitive tabs to easily access the required network performance data, improved page-loading speed, and quick links to information on how to go about doing some tasks with option to submit instant feedback, provide a smooth user experience.
Network Change, Configuration and Compliance Management in OpManager is achieved using the NCM plugin. Manage your network devices easily. Take regular configuration back-up, rollback to good know configuration in a single click, troubleshoot irregularities, audit changes, enhance security and comply with regulations from a single console. The latest version [Watch Video] of the plugin allows you to
Perform several bulk configuration and management tasks using the Quick Configuration Wizard, like associating notification profiles, alarm suppression, bulk-deletion, bulk association of monitors etc.
Configuration templates are available out-of-the-box for devices, interfaces, process monitoring, scripts monitoring, files & folders monitoring. Effect changes at the individual devices level or at the templates level to apply it to multiple devices/interfaces.
Now configure multiple thresholds namely Warning, Trouble, and Error for the performance monitors. This helps you break the fault into three stages and take corrective actions accordingly.
Now customize OpManager web client as per your requirements. You can create tabs for frequently visited pages, third-party embeds, reports, etc. and navigate easily in a click. You can also modify and delete existing tabs.
Automate your repeated IT actions using OpManager Workflows. The routine tasks that need execution either during network faults or as an on-going maintenance task, can be automated using this new module. Help document.
Performs intelligent event processing. It filters and correlates network events and presents only meaningful alarms to the Operator.
OpManager listens for SNMP traps from devices and processes them into meaninful OpManager alerts. All critical trap-types are supported out-of-the-box and it lets you define custom processors. OpManager provides you an option of loading the Traps from various MIBs dynamically from the Web Client.
OpManager can be configured to automatically notify users through email or SMS, whenever an alarm occurs. In-fact for Routers and Switches, you can select the interfaces for which you wish to be notified.
Get instantaneous information about current performance usage with Real Time Graphs. Available for any performance monitors (eg. CPU, Memory, Disk & etc.), Interface Traffic and Bandwidth Utilization
Access your OpManager anytime from anywhere using the new SmartPhone GUI. You need now wait to get to the root of the problem even if you are miles away.. The OpManager SmartPhone GUI lets you drill down the alert and perform the first level troubleshooting from wherever you are.
Even after tedious network performance audits, devices do fail. It is essential to know these network anomalies and act on it immediately. OpManagerʼs Syslog daemon helps you to know these irregularities within split seconds and empower your visibility into your network.
OpManager’s Windows Event Log Monitoring provides several automatic rules to monitor critical security logs across all windows servers and workstations in your network. You can easily detect events such as failed logons, logon failures due to bad passwords, account lockouts, failed attempts to access secure files, security log tampering etc.
Support Web alarm functionality to facilitate NOC staffs. NOC team will be clued-up onscreen immediately during network performance degradation or outage.
Write your own self-healing scripts and configure OpManager to trigger the script automatically to recover from a service or device failure.
If you are also using ManageEngine ServiceDesk Plus, you can Integrate OpManager and Configure to log a trouble ticket to a particular technician, Set category and priority dynamically. It is possible to log a ticket for every device type and parameters monitored.
OpManager provides a huge collection of critical troubleshooting tools to perform the first and second levels of troubleshooting viz. Switch Port Mapper, Real Time Graphs, Trace Route, Ping, Remote Desktop Top, Weblinks, MIB Browser & etc. More here.
Special add-on features are built into the Premium edition for monitoring
Perform operations like adding a device, associating a profile to devices etc using REST APIs. Using these APIs, you can create scripts to interact with OpManager or integrate OpManager with 3rd party IT management/service desk software.
OpManager supports MSSQL database in addition to bundled MySQL. Provision to migrate existing MySQL data to MSSQL is configurable. Utilities to facilitate the data backup and restore are bundled as part of the application.
OpManager provides exhaustive performance reporting with over 100 in-built reporting profiles out-of-the-box. All the reports are intuitively grouped by category and view besides exclusive dashboards for specialized servers like AD, Exchange, Virtual Servers etc. The reports can be exported and saved as a PDF/XLS file as well as printed or emailed. Various options for further customization are provided to create tailor-made reports from the in-built reports e.g. selecting of "Top N reports", changing the reporting period, changing the reporting business snapshot to consider another grouping of devices for the selected reporting profile etc..Complementing the daily, weekly and monthly performance reports is the option to schedule the reports. What's more! The reports can be automatically emailed to configured email Ids.
Connect to OpManager server and view the performance of all the devices, recent alarms, and business views from your iPhone. Download the App now.
When a technician acknowledges, unacknowledges, or clears an alarm in OpManager, the same is automatically posted on ITPulse wall. You can also view the details of such alarms from ITPulse itself and discuss the troubleshooting steps. [Watch Video]
To try IT Pulse, visit: http://www.youritpulse.com
