A whooping 40-60% of employees of enterprises today work in branch offices and access critical applications via WAN.
A poorly monitored WANs could wreak havoc at branch offices. Employees would get timed out of email services, critical ERP applications would show blank pages, video conferencing wouldn't work, VoIP phones would go useless, and someone would have to mercilessly wake you up in the middle of the night!

Companies expand to multiple cities, countries, and planets driven by factors such as outsourcing, making WAN links the lifeline for their day-to-day functioning. Having consolidated the servers into a central datacenter and having invested heavily on critical applications such as ERP/CRM/VoIP etc., enterprises have to ensure LAN-equivalent app performance over WAN to protect the investments made.
Poor WAN links result in situations such as the ERP application showing a blank page while a branch office employee accesses an order-processing module. The aftermath is deadly - productivity loss, opportunity loss, revenue loss and sometimes replacement of IT Managers!
Buying additional bandwidth every time latency hits the threshold is not good for an enterprise. In this article we will discuss how OpManager can help avoid that.
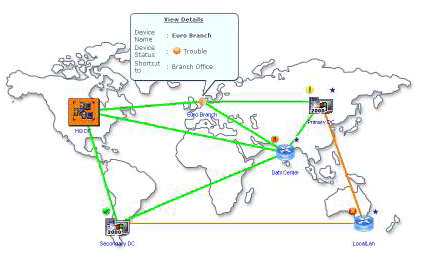
Network management software such as OpManager helps you visualize your WAN links using a graphical WAN Map. Whenever a link fails, the map reflects the failure and shows the link in red, orange, or pink colors depending on the severity.

Figure: Graphical Representation of WAN
A WAN link represents a logical connection between two routers. One router at the datacenter and the other at a branch office (usual scenario).
Enterprises buy WAN links from Telcos or ISPs such as MCI, Verizon, AT&T etc., based on the following characteristics:
| WAN Link Type | Speed |
|---|---|
| ISDN | 64 Kbps |
| T1 | 1.5 Mbps |
| T3 | 43 Mbps |
If the WAN Link is down, it means the entire branch office population behind the WAN link will not be able to access any application that is hosted in the datacenter.

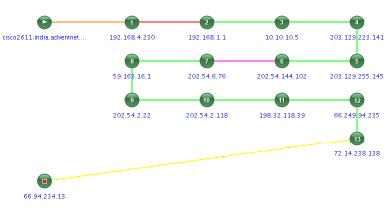
With OpManager, you can further drill down a problematic link and see where the failure has occurred, even if it is inside your service provider's network.

Figure: Link diagram showing exact point-of-failure on WAN
Every month you can generate reports on the availability statistics of each WAN link so that you can see if the ISP's assured availability percentage has been violated or not.

Figure: WAN Availability Reports - Daily/Weekly/Montly
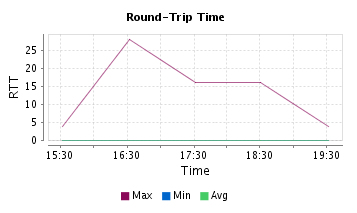
Measuring the time taken for a packet to travel from the source-to-destination-andback is required to ensure that the link is healthy. The time taken is called as round-trip-time or the latency. If the latency exceeds thresholds you need to analyze why it happened. The latency could be at the service provider end or it could be due to high congestion of traffic at your WAN links.

Figure: Latency or the Round-Trip-Time For a WAN Link
In a computer network, latency is an expression of how much time it takes for a packet of data to get from one designated point to another. It is sometimes measured as the time required for a packet to be returned to its sender. Latency and Round-trip-time are the same. (Except in case of VoIP where latency is measured one way - from mouth to ear - which means RTT/2)
Latency depends on the speed of the transmission medium (e.g., copper wire, optical fiber or radio waves), delays in the transmission by devices along the way (e.g., routers and modems), WAN topology (e.g., star, ring, mesh, tiered) and also with the distance between source and destination.
| Source-Destination | Latency in milliseconds |
|---|---|
| Regional round trips within Europe | 30ms or less |
| Intra Japan | 30 ms or less |
| Regional round trips within North America | 45ms or less |
| Transatlantic round trips | 90 ms or less |
| Intra Asia-Pacific | 125 |
| Transpacific round trips | 160 ms or less |
| UK to Korea | 470ms - highest latency figure between any two country |
Simply, a lot of your applications will crumble. VoIP for example works best at 150ms one-way latency rates. If this exceeds, voice packets will reach destinations with much delay that you will hear what the guy at the other end said yesterday! (Just kidding). Video conferencing and video games such as Xbox live would give poor user experiences. And finally your application that you have hosted in the datacenter won't be accessible for your branch office staff. It will most likely get timed out.
Acceptable latency and packet loss figures for some of the common applications:
| Application | Latency (ms) | Jitter (ms) | Packet Loss (%) |
|---|---|---|---|
| SAP | 100-300 | Not applicable | 1-3 |
| VOIP | 100-300 | Not applicable | 0-1 |
| WEB | 200-1000 | Not applicable | 1-5 |
| FTP | Not applicable | Not applicable | 1-10 |
| Not applicable | Not applicable | 1-10 |
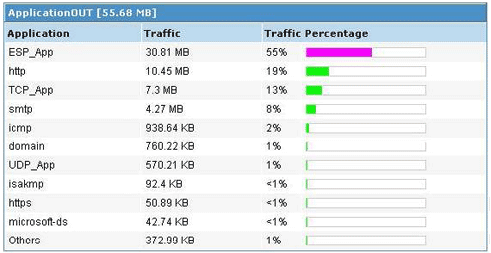
By monitoring the WAN traffic you can identify which application or which person is using the bandwidth. You can identity bandwidth utilization trends by these bandwidth reports.

WAN needs of every business vary but the fundamental need of high app performance stays. Poor WAN links can cause an IT manager his job and the company a lot of money. Companies may employ WAN optimization techniques or any other application delivery technique. But Network Management Software such as OpManager can help in the basic WAN Monitoring and come in handy when troubleshooting WAN problems.
