In modern day IT, it’s not the network that is up and running, it’s the IT administrators. Constant introduction of new devices, new technologies, patch upgrades, branch offices, etc. force the administrators to make frequent changes in the network, to include new devices and adopt new technologies. They go berserk as frequent changes affect the performance of the network, and work round the clock to fix it.
|
Business office proliferation
Day by day your business keeps expanding, and so your networks and the complexity in managing them. It gradually transforms you from the happy guy when you were managing few devices to the–one–who–lives–with–the–blackberry–24x7 managing a multiple branch offices
|
Balancing business demands & Technological advancements
You have to constantly adopt new technologies to meet your business demands. Initially, your business demanded just the network uptime and basic ICMP ping⁄port check was enough. Now your entire business relies on IT network and requires SLA, SLM, BSM & more. Therefore, any problem with the network will directly affect your revenue. This has pushed companies to sign up service level agreements within their organization itself
|
Aligning business and end–user preference
As an IT administrator you are tossed between business and end–user preferences. End users never wish to compensate or get blocked for accessing Facebook or YouTube. At the same time business critical applications should not strive for bandwidth⁄ other resources. It is very difficult to address both the needs without buying extra bandwidth⁄ resources month on month.
|
It’s neither possible to stop adding new devices, adopting new technologies nor limiting the branch offices. The only solution available for today’s network is 24x7 monitoring and an intelligent fault management to identify the root cause of the issue, and fix it before you feel its impact on your business.
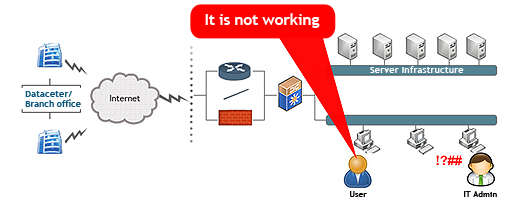
The common perception of fault management is identifying all the events. This, however, is not true. There is more to it than what meets the eye!
Any happening that has an impact on the network’s performance is called an event. It can be informational in nature, a cleared event, warning message, a trouble sign or even a critical fault. If all these events are pushed to the administrator, he would be drowned and helpless. Instead, an intelligent NMS must sort the events and only actionable faults must be presented to the administrator to work on.

A good fault management plan must have various mechanisms to detect the events, isolate and notify only the actionable faults to the administrators for resolution

Two types of monitoring – active and passive are equally important to have responsive event detection mechanism. Active monitoring helps proactively detect an event by setting up thresholds for the monitors. Some examples of active monitoring are ICMP Ping, TCP or UDP port check and performance counters monitoring. Whereas, in passive monitoring, the NMS listens for an event for e.g. Syslogs, SNMP traps and Windows event log messages
OpManager offers both active and passive monitoring. It monitors devices using ICMP ping, TCP & UDP ports and performance counters. It also monitors Syslogs, SNMP traps, event logs, etc
Fault isolation helps identify the events that have impacted the network’s performance. Fault management techniques such as De–duplication, Correlation and Automation, help in identifying the root cause
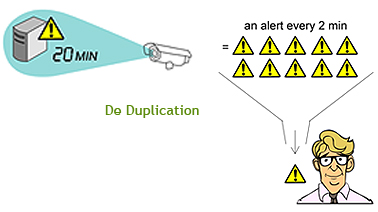
Consider a situation where a server is running at high CPU and the monitoring system polls the device for every 2 minutes. If the high CPU sustains for about 20 minutes, the monitoring system should not raise 10 alerts – a clear duplication. Instead it should show a single alert
OpManager, for every unique event, creates a new row item with the severity color code under the Alarms tab. If the same event occurs again, it is appended to the alarm history, thereby eliminating duplication
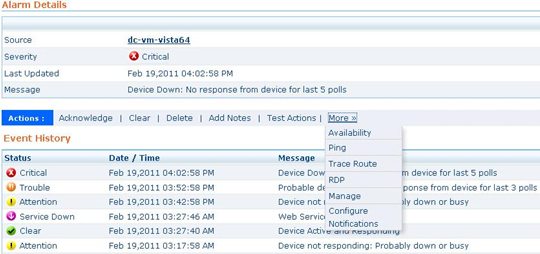
Similarly alarms correlation also helps in showing only actionable network faults. Consider a core switch that is connected to 50 servers is down. The NMS should not raise 51 alerts, stating all the 50 servers and 1 switch, are down – Instead, the NMS should automatically map the devices and raise a single alarm for the switch.
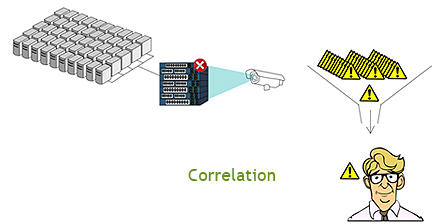
The "Device Dependency" option in OpManager helps avert such alerts. If the parent device is down, it raises alert only for the parent device. You will receive a single alert for the switch that has gone down. OpManager also automatically maps your servers to the network devices using its automated network mapping and custom network map functionality. This help the administrators see the outage or performance hiccups and troubleshoot quickly.
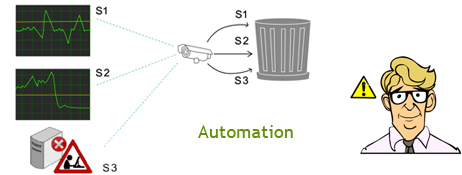
The final one, automated fault isolation, is all about dropping the unwarranted events. Negligible incidental spikes, alarm reverting to clear state, events for devices in maintenance mode, etc. are some examples of unwarranted events.
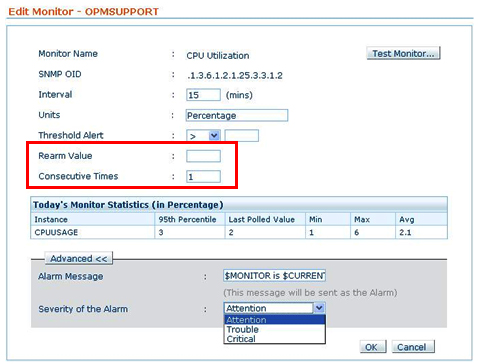
OpManager helps you ignore such unwarranted events. For active monitors, by configuring the "consecutive times" and "Re–arm value" in the threshold configuration screen, it allows you to ignore incidental spikes and clear the event. For passive monitoring, the suppression for such spikes is handled in the rules itself. For routine device maintenance, you can configure the "Downtime scheduler" in OpManager to suspend monitoring the devices during the maintenance window.
OpManager allows you to suppress alarms on need basis, using the "pause status polling" option. This option omes handy when you are working on a particular fault and want OpManager to stop polling the device, till the issue is resolved.
The core function of this process is to let you know about the actual problem. This can be through visual representation for the NOC administrators, trouble ticketing to helpdesk technicians and alerting remote administrators through Email or SMS.
To understand the issue and its root cause better, OpManager visualizes the performance bottlenecks through color coding of alarms, web alarms, dashboards, business views, etc. It also notifies the fault via Email, SMS, RSS feeds and Twitter. Its smartphone⁄ iPhone Graphic User Interface (GUI) helps administrators to quickly go through the alert and start troubleshooting.

For trouble ticketing, OpManager integrates with ManageEngine ServiceDesk Plus. For other help desk software, OpManager can be configured to send an email with the fault message and variables.
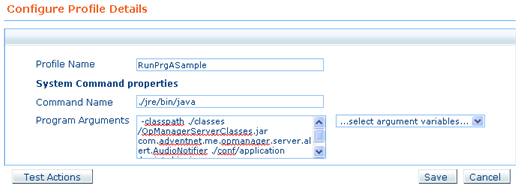
For faster fault resolution, the NMS should have a proprietary knowledge when handling faults. In case of any issue, the NMS should automatically run a particular command or program in a remote machine to fix it.
If it is not possible, due to some complication or error, the NMS should escalate the situation to the appropriate admin with the clear log message for next course of action.
In OpManager, for automated fault resolution, you can run self–healing scripts on the remote machine using "Run a program" or "Run a command" option. For e.g. if the hard disk is found to be running full in your MS SQL server, you can run a script to clear the transactions logs and restart the service from OpManager.
OpManager offers a wide range of troubleshooting tools that help you fix the problems in a wink. For server troubleshooting, OpManager has tools such as Remote Process Diagnostics (similar to launching a remote task manager), Device tools, ping, trace route, etc. For the network switches, OpManager provides Switch Port Mapper that maps every connected switch port. OpManager’s NetFlow Traffic Analysis module helps you analyze what type of traffic is going through a particular machine.
For WAN links, OpManager gives you a hop–wise visibility that lets you swiftly identify where the problem originated from. Usually, WAN link performance degradations are caused either due to high traffic or recent configuration changes done on the network device. OpManager’s NetFlow Traffic Analysis module helps you solve the traffic bottlenecks. You can use the NCM plug–in for the issues arising due to configuration changes. The NCM plug–in does a side–by–side comparison with the pervious configuration and restores the configuration if needed.
OpManager also includes Syslog viewer, in–built MIB browser, real–time performance graphs, etc. to manage your network better.
