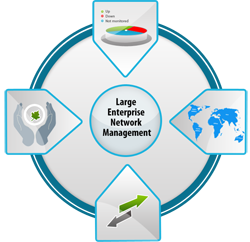
For large enterprises, the network management challenges don’t stop with just monitoring network and receiving alerts if something fails. It also extends to
Service and/or network downtime is a serious business threat given the complete dependence on IT for business. Businesses no longer set up SLAs for 99% availability. In keeping with the growing expectations, the acceptable availability is nothing less than 99.9%. A simple math for offering 99% vs. 99.9% availability shows how much is in stake for a company. The difference is a whopping 79 hours! For large enterprise this is really expensive and in financial terms what we are talking about is the cost of downtime ranging anywhere between $100K to over $1 Million per hour!
Type and cause of downtime: Most of the times it’s the people and process!
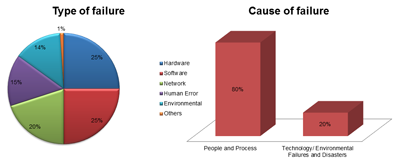
In another report, Gartner had mentioned that often NSM is the weakest link in business availability. This makes it essential to have the NMS continuously available to monitor your network 24x7 all throughout the year. If something goes wrong in the network, the NMS can detect and alert you before it affects the business or end-users.
For high availability of NMS, a standby system for redundancy support is necessary. In a standby system there will be always an active and passive node. Due to unforeseen reasons if the active node fails, the passive node starts resuming the service from where the active has left. This active/ passive system can be implemented in 3 different ways - Hot, Warm and Cold.
| Hot | Warm | Cold |
|---|---|---|
|
|
|
Hot standby mechanism is best suited for large enterprises as data back-up and Failover-Failback transmission are done automatically. Based on the need, this passive node can be deployed even at a disaster recovery zone. This helps you monitor your network 24x7.
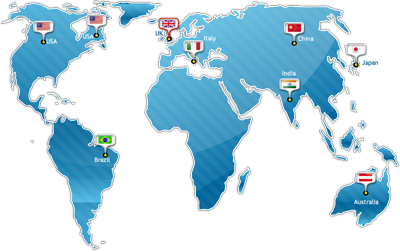 Enterprises are spread across multi-remote branch offices. Often the large enterprises are distributed across multiple countries.
Being a global company, following are the challenges the Network Management System (NMS) must meet
Due to de-centralized IT team and network management, it becomes complex to gain visibility across the network. The central team will have no clue when something goes wrong. Leave behind the hectic performance analysis and trend reporting; even a complete inventory of IT devices will be a huge task to consolidate.
To overcome these challenges, at times, organizations monitor remote devices over the WAN link leaving behind the false positives induced by the service provider due to latency or outages in their network and security concerns
Monitoring becomes complex when you have your presence all across the globe. If you have Far East presence, the commonly used devices are Hitachi or 3COM whereas in the West, it is more of Cisco or HP. Due to this regional differences, every remote office has its own region specific devices, and managing them for availability and performance is real pain when the NMS doesn’t offer multi-vendor support.
If you have branches across non-English speaking countries, it is one of the mandatory requisite to have a local language support to facilitate the onsite admins.
All these limitations discussed above can be made straight by choosing the right NMS architecture.
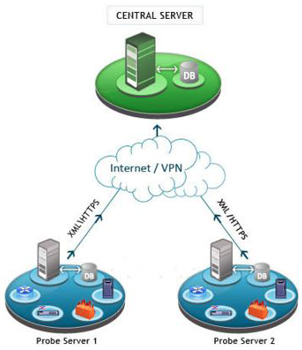 OpManager Enterprise Edition is built on a scalable Probe-Central architecture. It offers a centralized console to propagate network events across remote sites. It supports wide industry standard protocols with out-of-the-box device monitoring templates. The communication between the probe and central takes place over internet or WAN links across firewalls / proxy servers.
Though, in the market, various NMS with similar probe-central architecture are available, they point you to individual remote site instances to collect the data. In some cases the vendor pushes only the alarms to the central console, leaving the performance data. This makes it laborious to extract a performance trend or an inventory report for a specific site or across all sites. However, that is not the case with OpManager.
In OpManager, the site-level performance reports and network events can be extracted from both the central and probe web-clients. Further the user access can also be set at the remote-site probe and at the central server. This helps the remote admins navigate the desired information for the site they are in-charge of without affecting the centralized visibility.
OpManager’s probe has its own database similar to the central server. The data gathered by the probe is first stored in its database and then sent to the central server for providing a consolidated view. So even when there is a connectivity failure, the data is pManager Enterprise Editionaccumulated at the probe level and sent to the central server as soon as the communication link is up. For high availability, hot standby engine is available both at the central as well as at the probe level ensuring 100% data integrity.
By design the probe can monitor over 650 device types out-of-the-box. It pushes all the collected information to the central server. So the administrator in the central site can see the network event, extract performance reports for a particular site or for the complete IT infrastructure.
In addition to all the above, the probe communication is language independent. So you can have a probe in Portuguese and another one in Spanish to communicate to the central server which can be running in English. This helps you cross the language barriers as well.
Scalability is the next big thing when it comes to network management for large enterprises as they monitor more number of devices and interfaces, process huge amount of network events, data, reports, etc...
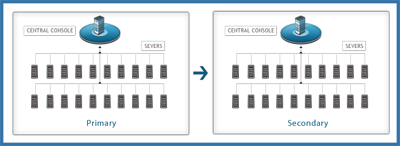
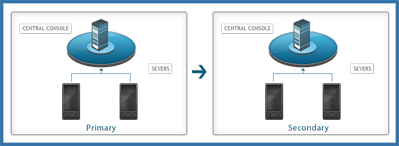
Assume your enterprise has 100,000 interfaces or 10,000 nodes or devices to monitor. How would you prefer to do it?
You can have 500 devices monitored per probe or the NMS instance and have 20 monitoring installations. Being the part of enterprise luxury, you have to provide the same amount of stand-by servers. This is again topped up with the central primary and secondary servers. In total you will have 42 devices to manage.
Alternatively you can manage them with 2 remote probes which are highly scalable. Here the number for servers sum up to just 6.Which one would you prefer? Though with server virtualization provisioning 40 servers is not a big thing, but the cost of OS and regular patching will certainly be a pain.
Distributing polling engine is a preferable model when you have more remote-sites to monitor. However, if you have a single datacenter which has most of the devices, the NMS solution should help you scale without splitting the load across multiple NMS instances.
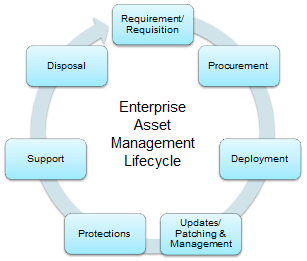 Most of the IT assets remain servicing for a longer period i.e. after deployment stage. The 3 stages after deployment – Updates/Patching & Management, Protection, and Support are really expensive when compare to the device initial cost.
So what is the cost of datacenter footprint to manage a 100,000 interfaces network or say 10,000 nodes / devices?
You can either split the load across 42devices or have it running only on few devices. The latter is much effective.
On top of the regular server maintenance task, it is also essential to gauge the software maintenance tasks such as data backup, upgrading, adding new devices to the monitoring system & more. So if you add more servers or more instances of NMS to manage the network, it is going to be relatively expensive to maintain.

A single probe of OpManager is capable of scaling up-to 50,000 interfaces or 2,500 devices. In most cases, this should be sufficient enough to monitor a large remote site or datacenter, and it leaves lesser footprints to deploy and maintain.
The Enterprise edition inherits the usability aspects from the standalone version of OpManager. This lets you quickly deploy the product for the production.
Unlike other NMS software, you don’t have to upgrade individual probes by remotely connecting to the server it is running on. With OpManager you just upgrade the central server, which in turn pushes the upgrades to the dependent probes. These make OpManager easy to use in an enterprise infrastructure.
Just by having more devices to manage, multiple locations and expensive downtimes doesn’t liberalize the IT budget. The goal is still “Do more with less”.
With ManageEngine, you can rest assured that what you have is value for money. For over a decade ManageEngine offers enterprise IT management suite of products at 90:10 promise - 90% of the features of big 4 at 10% of the price.
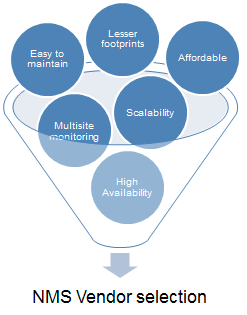 Though you find many vendors meeting most of the above discussed requirements, are they trustworthy as ManageEngine?
The minimum durability expected out of an investment in a solution today is anywhere between 3 to 5 years. ManageEngine has a solid history background and the product line, right from the day it is founded.
ManageEngine’s parent company, ZOHO Corporation started off by serving telecom and OEM industry to manage their IT equipment. Even industry leaders such as Motorola, AT&T, Vodafone, Cisco, Citrix, & Time Warner Cable many others use its WebNMS product, a network management framework.
ManageEngine inherits these experiences and serves enterprise IT for close to a decade now. ManageEngine covers the entire gamut of IT management products with over 30 different products. It has over 60,000 enterprise customers across 100+ countries.
OpManager is the flagship product of ManageEngine with over 10,000 enterprise customers across 93 countries. Over a million administrators use OpManager for their day-to-day network management.
OpManager is a complete, end-to-end network monitoring software that offers advanced fault and performance management functionality across critical IT resources such as routers, WAN links, switches, firewalls, VoIP call paths, physical servers, virtual servers, domain controllers, MS Exchange, MS SQL & other IT infrastructure devices.
Further it combines an easy-to-use interface that lets you quickly deploy the product for production and apply your organization's monitoring policies across multiple devices instantly. In short it is a unified approach to manage your complete infrastructure.
Download a 30 days free trial of OpManager and give it a try in your network. Visit www.opmanager.com for more information.
