The latest developments happening in OpManager are given below.
OpManager includes scheduled discovery option which helps you create a discovery profile and rediscover existing as well as new devices at scheduled intervals. You can rediscovery devices by IP range,CIDR and CSV file. It also includes a filter option to add/remove devices as per your need. You can also select discovery rules while creating a discovery profile.

OpManager now discovers VLAN and groups all the interfaces pertaining to a VLAN. It uses SNMP to find out the VLAN name, VLAN ID and the interfaces that are in that VLAN. OpManager also provides how much bandwidth is consumed by each VLAN.

OpManager now supports monitoring Windows clusters. It monitors the parent and child servers for availability and performance. OpManager also provides a map of the cluster.

Import details of data center floors, racks, devices, position of devices on a rack, etc. from rack management software vendors such as Device42 and RackTables into OpManager. OpManager also supports importing such details via a CSV as well.
OpManager monitors Citrix Xen server Host, VM and Storage Repositories for performance via Xen API. It also offers a topology map of the Citrix Xen server.
OpManager now includes a simulator that helps you easily simulate 500 devices and test its reliability.
Self Monitoring is a feature which allows OpManager to monitor itself for ensuring optimum performance. It monitors parameters such as Data Collection Rate, Disk Free Space, Database Size and many more..
With OpManager's improved scalability engine, you can manage upto 50,000 interfaces per probe. This helps you scale 5x more than previous versions.
OpManager now includes a rack builder for Cisco UCS. With the Cisco UCS Rack Builder you can create a virtual representation of the actual Cisco UCS with all the components such as chassis, fabric interconnects, blade servers, etc. The virtual UCS rack provides the live operable status of each component using color codes. The virtual UCS rack can also be placed on a 3D data center floor.
OpManager workflow engine now includes actions to get Top 10 sources, applications and conversations that choke your bandwidth. With the workflow, you can automatically trigger these actions whenever any bandwidth bottleneck alarm is raised leveraging the NFA plugin. The result of the workflow More...
the list of the top 10 sources, applications and conversations that are hogging the bandwidth - is either added as notes to the alarm or sent as an email. This provides visibility into network traffic for troubleshooting and, at the same time avoids the repetitive manual work done by you.
Now monitor the performance of your servers running mission critical applications such as Exchange in real-time with OpManager agent. The agent monitors More...
In case if any service or process goes down, the agent raises an alarm in OpManager instantly. The data collected using perfmon is shown as a graph (High Resolution Graph). You can zoom in the graph to view per second historical data.
System Requirements for AgentNow automate resource optimization of VMware resources with OpManager's resource automation feature. Using the vCenter APIs, OpManager can now periodically compare each VM's peak utilization against the allotted resource settings and can automatically re-size the VMs to 10 percent more than the peak utilization, so that the VMs remain lean and fit.
Now monitor highly distributed remote devices (Windows only) such as POS devices, Kiosks, billboards, etc. with OpManager's monitoring agents. The monitoring agent periodically collects the performance data of the device in which it is installed, and sends it to OpManager server. You can set threshold to performance monitors and proactive receive alerts. You can also associate notification profiles to the agent installed devices for instant notification.
This OpManager LEE exe includes the support to automatically migrate data from OpManager EE. It provides an option to extract configuration and historical data from OpManager EE (Central server), and populate in its own DB.More...
Step to migrate data
The LIVE PPM Upgrade helps you stay up-to-date with the latest version of OpManager. Whenever a new version/update gets released, OpManager downloads it and starts upgrading itself during the time scheduled by you.
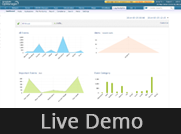
With the help of ELA Plug-in, you can now automate the process of managing terabytes of machine generated logs, monitor file integrity, conduct log forensics analysis, monitor privileged users, comply to different compliance regulatory bodies and instantly generate variety of reports.More...
It also offers Real-time Event Response System for proactive threat management that triggers alert notification via EMail ,SMS and also provides automatic alert remediation by program execution.
With OpStor Plug-in, you can monitor storage devices like Storage Arrays, Fabric Switches, Tape Libraries, Host servers and Host Bus Adapters cards from all leading vendors in the industry. It provides a unified view of storage environment along with effective reporting which in-turn increases visibility and reduces the time taken to detect any faults.
With the help of RDP client in OpManager, network admins can now connect to their Remote Desktops (Windows-based) directly from OpManager by providing the WMI credential.
Create an OSI L2/L3 network map with OpManager's Topo Mapper. Just add your core router in OpManager's TopoMapper, it automatically pulls the details of other network devices connected to the core router, adds them in OpManager and draws a network map. From the map you can identify the status of the devices also. More...
Steps to install:
Note:

OpManager UI now support multiple languages irrespective of the language in which it is installed. Users can select the desired language from Admin-> Personalize-> Language Selection.
CMDB Plug-in helps you to get in-depth visibility of your assets present in your IT environment. This allows you to manage all your IT components based on their business criticality and make informed decisions
Enterprise IT departments need sophisticated monitoring for each aspect of their operations, from basic infrastructure to bandwidth, applications and change management. However, these sophisticated tools churn out alerts at an alarming rate and volume, making it difficult to manipulate the alerts and find the root cause of the problem. More...
OpManager streamlines that process with a new 360-degree root cause analysis tool that tracks all the alerts from ManageEngine's NetFlow, configuration management, and application management plug-ins. It then creates a single, correlated alert based on predefined rules and plots the event flow on a time-based, multi-series graph. Ultimately, it helps users to see causal relationships, which are needed to perform the root cause analysis.
OpManager draws its L2 topology maps automatically, leveraging its new, L2 discovery option to capture all network devices, including routers, switches, physical servers, storage devices and virtual machines.
The new improved OpManager alarms page now provides users with More...
OpManager now automatically associates all the necessary MSSQL monitors during device discovery itself. This is done by leveraging OpManager's Rule Engine. In the Rule Engine, a rule has been created to identify the device that has MSSQL running and add the necessary MSSQL monitors.
OpManager now discovers the local host server in which it is installed and associates CPU, memory & disk utilization monitors and process monitors ("java.exe" and "postgres.exe" / "sqlservr.exe") automatically.
OpManager's Workflow Engine now includes network configuration actions such as backup configuration, execute configuration template, execute configuration commands, and get last N changes done. More...
With theses actions, when an alarm is raised in OpManger, you can automatically:
These actions work only when NCM plug-in is installed.
Monitor hardware health such as temperate, voltage, power, fan speed, status of processors, disk arrays, etc. of HP, Dell and Cisco systems with OpManager, via SNMP. OpManager raises alarm in case of any fault and also offers historical reports.
Now with OpManager create an exact replica of your data center. The new 3D floor builder option allows you add the racks and place it in the virtual data center floor. You can also embed these floors as widgets in OpManager and view it from on NOC screens and iPad.
Bingo! you can now clear an alarm with ALT+C right from your keyboard. No more click click click. Navigate device snapshot pages, alarm snapshot pages, Maps everything from your keyboard keys. Welcome to a high productive, ultra fast, responsive, api driven opmanager user interface. More...
Create a virtual rack with all the devices, resembling the original one, from the OpManager web client itself. This helps you have a quick glance of the devices present in the rack along with their status.
OpManager includes support for monitoring IPv6 network devices and servers. You can discover them in bulk by mentioning the IP range or by uploading a CSV file. Post discovery, the device templates with the essential monitors are applied on the IPv6 devices and monitored for performance.
Now monitor applications such as Oracle, SAP, Sharepoint, Websphere and much more with applications monitoring plugin and alerts for performance hiccups. With this plugin, OpManager now gives visibility into your applications performance as well.

Now the support for Central server failover is available in beta. If the Central server primary goes down, the secondary takes control automatically. All the probes automatically communicate to the secondary server. No data is lost.
Now get granular visibilty on the performance and health of your virtual clusters, vHost and VMs through vCenter API support in OpManager.
Note: Until now OpManager has been providing insights on the performances of VM host/ guest machines by directly querying the vHost using the vendors API.
Leveraging the VMware's API, OpManager extends its capability to monitor vHost's hardware health. These include powers supply, temperature, processors,and CPU fan speed sensors. The hardware health data are presented as visually elegant graphs and reports.
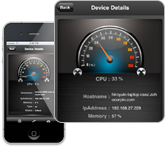
Manage your IT on the fly with OpManager iPhone App. With the app you can connect to OpManager server and view the performance of all the devices, recent alarms, and business views.
With AD authentication in OpManager, you can allow the users or the individual OU groups under a particular domain in the active directory to gain read-only or admin access to OpManager.
An exclusive device monitoring template and dashboards are created for NetApp storage devices monitoring. Similar to any other SNMP enabled devices monitoring, discover, monitor and stay informed on what's happening on your NetApp storage infrastructure.
Now OpManager integrates with ManageEngine ITPulse (beta), an enterprise social network software hosted on Zoho's Cloud. More...
Steps to Integrate OpManager and ITPulse
Now the alerts acknowledged, unacknowledged, cleared, and deleted by the user will be automatically posted in ITPulse's wall.
Now manage your IP addresses with details such as used and available IP address in your network, and get the complete mapping of all the switch ports to the devices connected to each of the ports with IP Address Manager (IPAM) & Switch Port Mapper (SPM) plug-ins.
Save your invaluable time with OpManager's Rule Engine (beta). The Rule Engine, associates service/process/file/folder monitors to devices during device discovery itself. More...
When discovering a network, the Rule Engine verifies the devices in the network with the set of rules created in it. Each rule has a set of conditions and actions. Devices that satisfy a rule (conditions defined in it) are associated with the actions defined in the same rule.
Now customize the tabs in OpManager web client as per your interest or requirements. It is very easy to add/remove/modify tabs. The tab customization option helps you place links of repeated actions such as adding service monitors and VoIP monitors in the main level or sub-level. This helps you carry out repeated configurations in a single click. You can also embed video, reports, dashboard of other products in OpManager web client.
Monitor log files of business critical applications with OpManager, and receive instant alerts when specific entries such as a text phrase or regular expression is added to the log file. More...
OpManager introduces an agent, which is lightweight and easy-to-install, to continuously monitor the log file available in a server for a specific text phrase or regular expression. Once the application prints the specified text phrase or regular expression, OpManager raises an alarm. Go through the video to know the exact steps.
Now discover 50,000 interfaces with OpManager's ultra fast discovery engine in less than 8 minutes. This video shows the simulated devices discovered in OpManager. More...
Steps to use simulator:
The new business view includes advanced editor that offer various options such as multiple objects select, edit, move, etc. The maps used in business views are also enhanced. More...
The new enhancements include:
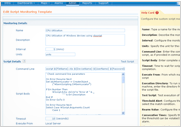
Run in-house scripts on your remote Windows or Linux server; capture the output in OpManager, set thresholds and get alerted for any noticed deviations. Supports jscript, vbscript, perl script, powershell script, Linux shellscript, et all..
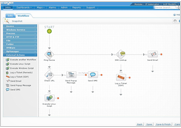
Orchestrate network fault management and routine network management tasks: Define, Build, Organize and manage what you wish to do when a fault strikes. Also automate laborious manual task using Runbook automation.
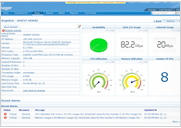
In addition to OpManager's VMware monitoring, the upcoming release will support Hyper-V monitoring too.
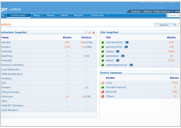
No more feature catch-up with stand-alone versions. The new Distributed Edition underwent a make-over. The new avatar will ensure that the same set of features remain common across all editions of OpManager, besides a highly scalable and reliable architecture.
If you have any clarification⁄ help, please contact us at opmanager-support@manageengine.com
